
Disclaimer: This article is for informational and educational purposes only and is not investment advice. Past performance does not guarantee future results. All figures are as of September 30, 2026 unless stated otherwise. See the full disclaimer at the end.
Quick Answer: Looking at mutual funds performance in last 5 years (to September 30, 2026), Fidelity Select Semiconductors (FSELX) led high-risk funds at 37.82% a year, while Fidelity Capital & Income (FAGIX) topped bond funds at 6.38%. Both beat the Dow’s 8.51% and the NASDAQ’s 13.20% annual price gains over the same period.
Five years is long enough to include a full market cycle, and the last five have been anything but quiet. Investors sat through the 2022 bear market, a historic bond rout, the AI-driven rally of 2023 to 2025, and now a Federal Reserve that is raising rates again. Reviewing mutual funds performance in last 5 years shows who actually got paid for taking risk, and who didn’t.
The short version: concentration won. Funds that bet heavily on semiconductors, energy and gold miners crushed the broad market. On the fixed income side, the bond funds that held up were the ones that avoided long-duration Treasuries entirely.
This guide covers the five best performing high-risk mutual funds and the five best debt (bond) funds over that window, how each tracked the Dow Jones and NASDAQ, what institutional and foreign money flows are signaling, and the future outlook of mutual funds heading into 2027.
How Were These Funds Selected?
The screen focused on open-end US mutual funds that individual investors can actually buy today. ETFs were excluded, as were funds closed to new investors.
To keep the mutual funds performance in last 5 years comparison fair, the ranking uses one number: 5-year annualized total return as of the September 30, 2026 month-end, as reported on Charles Schwab’s mutual fund research pages. Returns assume dividends and capital gains were reinvested and are adjusted for any sales charges. Expense ratios, assets and Morningstar ratings come from the same platform’s fund summary pages.
The universe screened covered widely held no-load funds from Fidelity, Vanguard and T. Rowe Price, across technology, sector, large-growth, high-yield, bank loan, multisector and short-term bond categories. That is a practical universe, not every fund in America, so treat this as a shortlist rather than a definitive league table.
One caveat about the index comparison. The Dow and NASDAQ figures used here are price returns, while fund figures are total returns that include reinvested income. That gap modestly flatters the funds, especially versus the dividend-heavy Dow.
Mutual Funds Performance in Last 5 Years: Top 5 High-Risk Funds
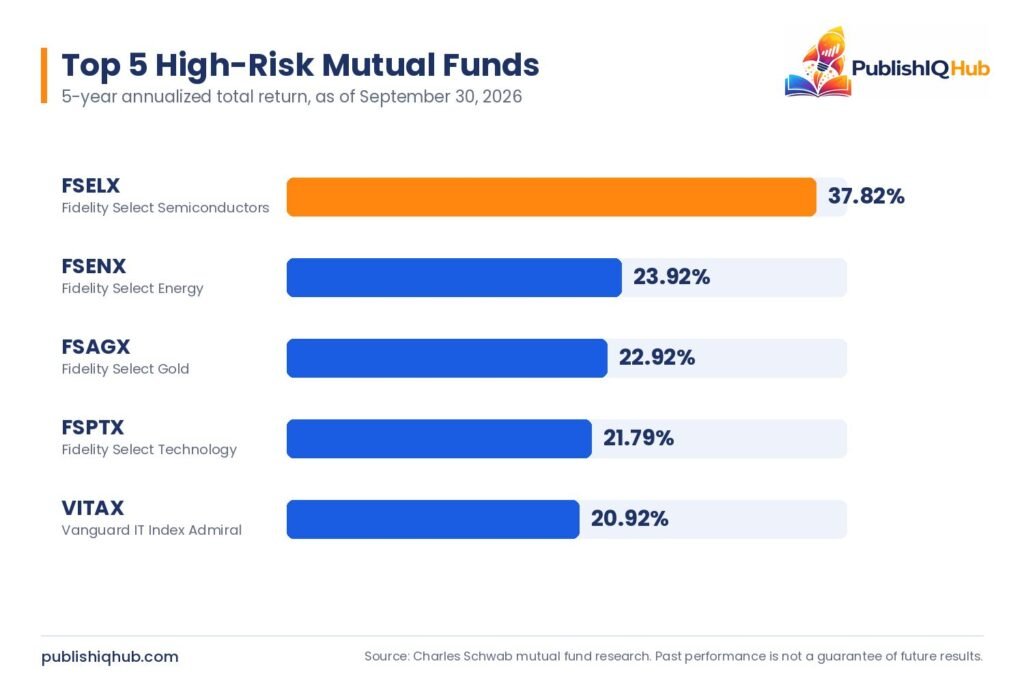
These are the best performing mutual funds last 5 years in the high-risk bucket. Every one of them is a sector fund, which says a lot about where returns came from.
1. Fidelity Select Semiconductors Portfolio (FSELX)
- 5-year annualized return: 37.82%
- 3-year / 1-year: 56.04% / 74.47%
- Net expense ratio: 0.60%
- Total net assets: $48.0 billion
- Morningstar rating: 5 stars (Technology category)
FSELX is the standout of the entire period. A $10,000 investment five years ago would be worth roughly $49,700 today at that annualized rate. The catch is concentration: NVIDIA alone was 24.93% of the portfolio and Broadcom another 14.93%, with the top 10 holdings at 75.61% of assets, per StockAnalysis holdings data as of October 9, 2026.
The fund also lost 29.26% in Q2 2022 alone. Anyone who sold that quarter missed the recovery.
2. Fidelity Select Energy Portfolio (FSENX)
- 5-year annualized return: 23.92%
- 3-year / 1-year: 15.21% / 46.45%
- Net expense ratio: 0.65%
- Total net assets: $4.1 billion
- Morningstar rating: 4 stars (Equity Energy)
Energy’s run looks very different from tech’s. It surged in 2022, stalled for two years, and then caught a second wind in 2026 as crude traded in the mid-$90s amid the conflict involving Iran. That 1-year number of 46.45% is almost entirely a 2026 story, and oil-driven gains tend to reverse just as quickly.
3. Fidelity Select Gold Portfolio (FSAGX)
- 5-year annualized return: 22.92%
- 3-year / 1-year: 49.71% / 21.05%
- Net expense ratio: 0.64%
- Total net assets: $4.0 billion
- Morningstar rating: 3 stars (Equity Precious Metals)
Gold miners rarely make lists like this. Over the last three years, though, FSAGX returned 49.71% a year, rivaling chip stocks. Its 10-year figure of 11.68% is a reminder of how long this sector went nowhere before the rally.
4. Fidelity Select Technology Portfolio (FSPTX)
- 5-year annualized return: 21.79%
- 3-year / 1-year: 39.69% / 47.17%
- Net expense ratio: 0.61%
- Total net assets: $39.3 billion
- Morningstar rating: 5 stars (Technology)
FSPTX gives broader tech exposure than FSELX, covering software, hardware and semiconductors. That spread cost it about 16 percentage points a year against the pure chip fund, yet it still came in well ahead of the NASDAQ Composite.
5. Vanguard Information Technology Index Fund Admiral Shares (VITAX)
- 5-year annualized return: 20.92%
- 3-year / 1-year: 35.04% / 35.19%
- Net expense ratio: 0.09%
- Total net assets: $177.9 billion
- Morningstar rating: 4 stars (Technology)
VITAX is the only index fund on the list and by far the cheapest. Its top three holdings, NVIDIA (17.74%), Apple (15.80%) and Microsoft (11.52%), make up about 45% of the fund, per StockAnalysis. Investors get the AI trade at a 0.09% fee, but they also get the same concentration risk as the active funds above.
Just missing the cut: Vanguard Energy (VGENX, 18.26%), Fidelity OTC (FOCPX, 17.61%) and T. Rowe Price Science & Technology (PRSCX, 16.61%). Fidelity Growth Company (FDGRX) returned 17.45% but is closed to most new investors.
Top 5 Debt Funds (Bond Funds) by 5-Year Performance
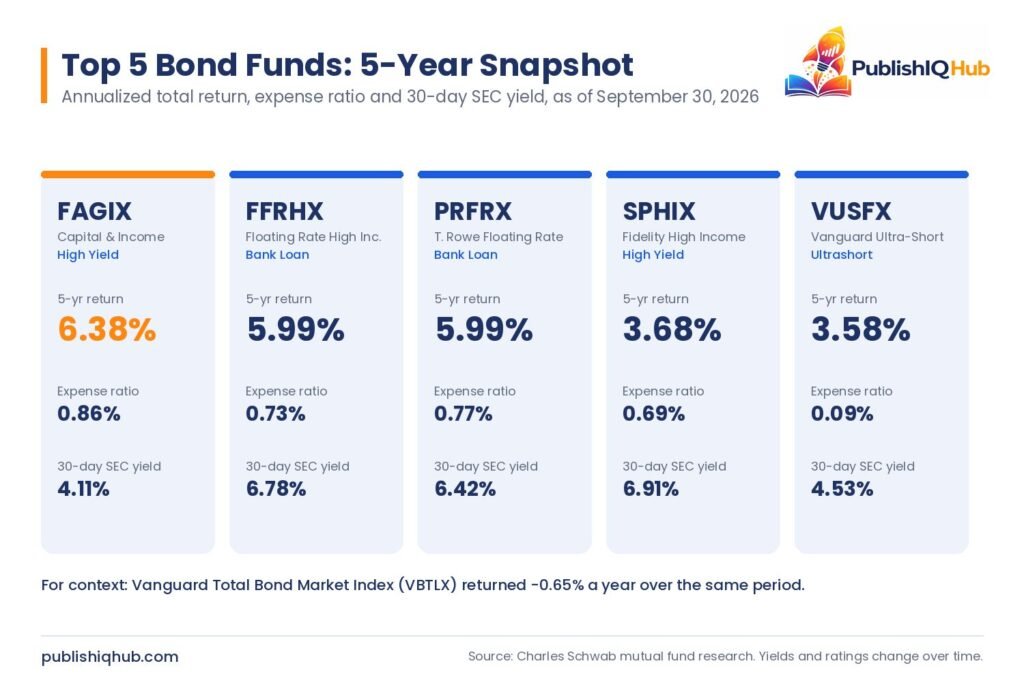
Bond investors had a far rougher five years, and mutual funds performance in last 5 years looks very different on the fixed income side. For context, the Vanguard Total Bond Market Index Fund (VBTLX), a common core holding, returned -0.65% a year over the period. The best bond funds to buy in 2026, at least by trailing returns, all share one trait: little sensitivity to rising interest rates.
1. Fidelity Capital & Income Fund (FAGIX)
- 5-year annualized return: 6.38%
- 3-year / 1-year: 12.07% / 8.25%
- Net expense ratio: 0.86%
- Total net assets: $15.7 billion
- 30-day SEC yield: 4.11%
- Morningstar rating: 5 stars (High Yield Bond)
FAGIX ranks first in its high-yield category over 1, 3, 5 and 10 years, according to Schwab’s category rankings. It is not a pure bond fund. Corporate bonds were 56% of assets, with sizable cash (25.27%), bank loans and preferred stock as of June 30, 2026, and the fund can hold equities.
2. Fidelity Floating Rate High Income Fund (FFRHX)
- 5-year annualized return: 5.99%
- 3-year / 1-year: 6.77% / 4.80%
- Net expense ratio: 0.73%
- Total net assets: $14.9 billion
- 30-day SEC yield: 6.78%
- Morningstar rating: 4 stars (Bank Loan)
Floating rate funds hold bank loans whose coupons reset as rates move. When the Fed hiked aggressively in 2022 and 2023, that structure was exactly what investors needed. FFRHX beat its bank loan category average of 5.08% over five years.
3. T. Rowe Price Floating Rate Fund (PRFRX)
- 5-year annualized return: 5.99%
- 3-year / 1-year: 7.10% / 4.41%
- Net expense ratio: 0.77%
- Total net assets: $4.0 billion
- 30-day SEC yield: 6.42%
- Morningstar rating: 4 stars (Bank Loan)
PRFRX tied FFRHX on the 5-year number and actually edged it on the 3-year. The fund’s own strategy notes that most of its loans are rated below investment grade, so the yield comes with genuine credit risk.
4. Fidelity High Income Fund (SPHIX)
- 5-year annualized return: 3.68%
- 3-year / 1-year: 9.04% / 2.80%
- Net expense ratio: 0.69%
- Total net assets: $3.0 billion
- 30-day SEC yield: 6.91%
- Morningstar rating: 3 stars (High Yield Bond)
SPHIX is a more traditional junk bond fund, with corporate bonds at 78.65% of assets.
5. Vanguard Ultra-Short-Term Bond Fund Admiral Shares (VUSFX)
- 5-year annualized return: 3.58%
- 3-year / 1-year: 5.09% / 3.50%
- Net expense ratio: 0.09%
- Total net assets: $15.9 billion
- 30-day SEC yield: 4.53%
- Morningstar rating: 3 stars (Ultrashort Bond)
This is the “boring” pick, and that’s the point. VUSFX holds very short-term corporate and asset-backed debt, so it barely felt the rate shock.
Comparison Table: All 10 Funds at a Glance
| # | Fund | Ticker | Category | 5-Yr Annualized | Expense Ratio | Assets | Risk Level |
| 1 | Fidelity Select Semiconductors | FSELX | Technology | 37.82% | 0.60% | $48.0B | Very High |
| 2 | Fidelity Select Energy | FSENX | Equity Energy | 23.92% | 0.65% | $4.1B | Very High |
| 3 | Fidelity Select Gold | FSAGX | Precious Metals | 22.92% | 0.64% | $4.0B | Very High |
| 4 | Fidelity Select Technology | FSPTX | Technology | 21.79% | 0.61% | $39.3B | High |
| 5 | Vanguard Info Tech Index | VITAX | Technology | 20.92% | 0.09% | $177.9B | High |
| 6 | Fidelity Capital & Income | FAGIX | High Yield Bond | 6.38% | 0.86% | $15.7B | Moderate-High |
| 7 | Fidelity Floating Rate High Income | FFRHX | Bank Loan | 5.99% | 0.73% | $14.9B | Moderate |
| 8 | T. Rowe Price Floating Rate | PRFRX | Bank Loan | 5.99% | 0.77% | $4.0B | Moderate |
| 9 | Fidelity High Income | SPHIX | High Yield Bond | 3.68% | 0.69% | $3.0B | Moderate-High |
| 10 | Vanguard Ultra-Short-Term Bond Admiral | VUSFX | Ultrashort Bond | 3.58% | 0.09% | $15.9B | Low |
Returns as of September 30, 2026. Source: Schwab mutual fund research. Risk levels are PublishIQHub’s qualitative assessment based on category and concentration, not a rating from the fund company.
Mutual Fund Performance vs Dow Jones and NASDAQ: How Did These Funds Track the Market?
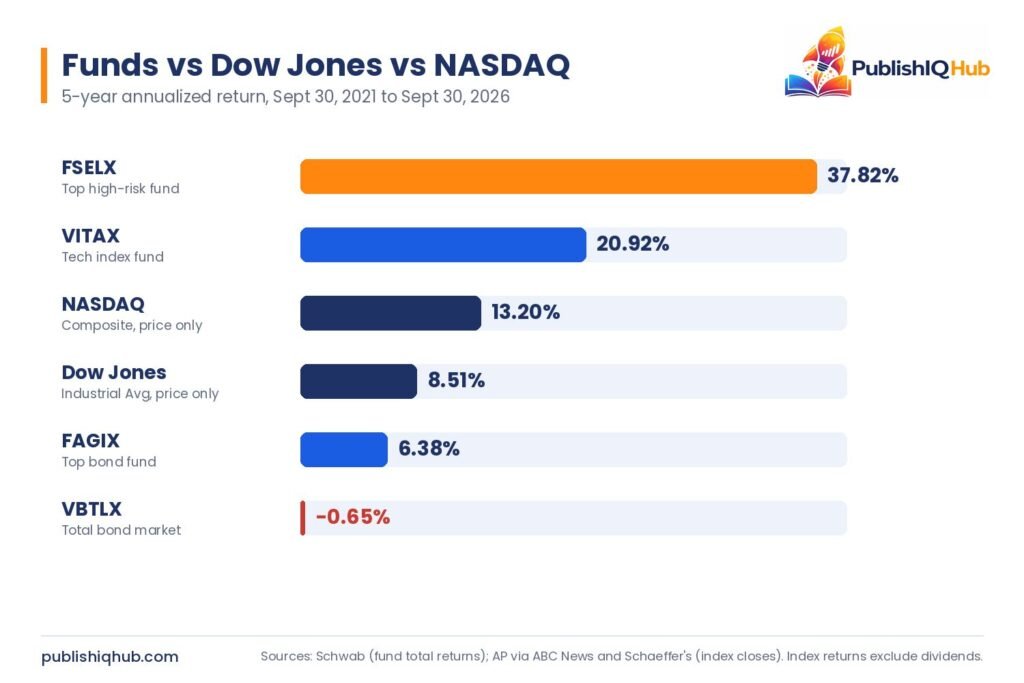
The Dow Jones Industrial Average closed at 33,843.92 on September 30, 2021, according to Schaeffer’s Investment Research. Five years later it finished at 50,906.05, per the AP market summary via ABC News. That works out to a 50.4% price gain, or about 8.51% a year.
The NASDAQ Composite went from 14,448.58 to 26,861.06 over the same dates, an 85.9% gain or roughly 13.20% a year. The S&P 500 sat in between at about 12.18% a year.
So how do mutual funds correlate with the stock market? The answer depends heavily on what they own:
- Tech funds behaved like a leveraged NASDAQ. VITAX, FSPTX and FSELX all moved in the same direction as the NASDAQ, but with bigger swings. When the NASDAQ fell in 2022, VITAX lost 29.67% for the calendar year, and when tech rallied in 2023, VITAX gained 52.68%.
- Energy and gold funds had little to do with either index. Their best stretches came from commodity prices, not earnings growth at large US companies.
- The Dow lagged because of what it holds. It is a price-weighted index of 30 blue chips, as S&P Dow Jones Indices describes it, with less exposure to the chipmakers that drove the period. In September 2026 alone, the Dow fell 4.9% while the NASDAQ rose 1.7%.
- Bond funds showed low correlation to stocks, but not to rates. High-yield and floating rate funds tracked credit conditions. Core bond funds like VBTLX tracked Treasury yields, which is why they disappointed.
The pattern for mutual fund performance vs NASDAQ is clear, and it is the single biggest lesson from mutual funds performance in last 5 years: active and index tech funds beat the index by owning more of its winners. On mutual fund performance vs Dow Jones, nearly any growth-oriented fund came out ahead.
Institutional and Foreign Investor Holdings: What the Money Flows Show
Readers searching for FII and DII holdings will find the US equivalent tracked differently. Domestic institutions file quarterly 13F reports with the SEC, foreign flows are measured by the Treasury’s TIC system, and fund flows are tracked by the Investment Company Institute.
Domestic institutions (the DII side). US-registered funds held 33% of all US corporate equity at the end of 2025, according to the ICI 2026 Investment Company Fact Book. Total US fund assets reached $45.1 trillion, with $31.4 trillion in mutual funds.
The shift from mutual funds to ETFs. That same report shows record ETF net issuance of about $1.5 trillion in 2025. The trend hasn’t slowed. In the week ended September 30, 2026, long-term mutual funds saw estimated outflows of $55.34 billion while ETFs took in $53.38 billion, per ICI’s weekly flow data. Taxable bond funds still gathered $4.14 billion that week, a sign that higher yields are pulling cash back into fixed income.
Foreign investors (the FII side). The latest Treasury International Capital release, published September 16, 2026, showed net TIC inflows of $83.7 billion in July. The detail is more telling: foreign official institutions bought $44.4 billion of long-term US securities, while private foreign investors were small net sellers at $3.7 billion. That compares with $207.1 billion of total foreign net purchases in June.
Put simply, domestic money is moving from mutual funds into ETFs, and foreign private buyers turned cautious in mid-2026 as yields rose.
Future Outlook of Mutual Funds: Rates, the Fed and AI Concentration
Any future outlook of mutual funds has to start with interest rates. The backdrop for the next five years looks nothing like the last five began. On September 16, 2026, the Federal Open Market Committee voted 12-0 to raise the federal funds target range to 3.75% to 4.00%, citing inflation that remains elevated, according to the Fed’s official statement. It was the first hike since July 2023.
The Fed’s updated projections pointed to a median rate of 4.1% for both 2026 and 2027, with 16 of 18 officials expecting another hike this year, as Chase summarized. August CPI inflation ran at 3.4% year over year. Meanwhile the 10-year Treasury yield climbed to about 5.29% on September 30, per Yahoo Finance’s market coverage.
Here is what that means for each fund type:
For high-risk equity funds. Higher discount rates usually pressure richly valued growth stocks. Tech funds have so far shrugged this off thanks to AI-driven earnings, but their concentration in a handful of names leaves little margin for error. Energy funds depend on oil prices staying high, which is tied to geopolitics rather than fundamentals investors can forecast.
Are bond funds a good investment when rates rise? It depends on duration. Floating rate funds like FFRHX and PRFRX benefit directly as coupons reset higher. Ultra-short funds like VUSFX reinvest quickly at new yields. Long-duration core bond funds lose value as yields climb, though a starting 10-year yield above 5% means much more income going forward than investors had in 2021.
For credit-heavy funds. High-yield and bank loan funds face a real test if higher rates slow the economy and defaults rise. Their recent returns came during a period of strong corporate earnings.
For a deeper look at how rate decisions ripple through borrowing costs, see PublishIQHub’s analysis of the Fed rate hike and its impact on EMIs.
Growth Funds vs Bond Funds: Which Is Better for You?
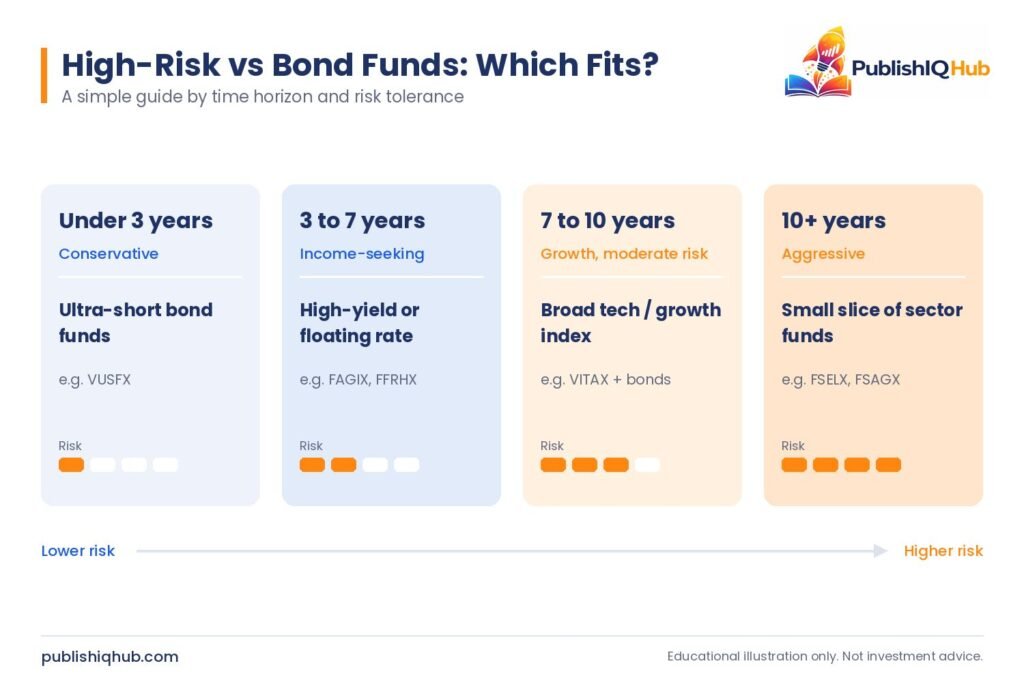
Neither, on its own. The right mix depends on time horizon and how much volatility an investor can stomach without selling.
| Investor Profile | Time Horizon | Possible Emphasis |
| Aggressive, comfortable with 40%+ drawdowns | 10+ years | Small allocation to sector funds like FSELX or FSAGX alongside a diversified core |
| Growth-focused, moderate volatility | 7 to 10 years | Broad tech or growth funds like VITAX, balanced with bond exposure |
| Income-seeking | 3 to 7 years | High-yield or floating rate funds such as FAGIX or FFRHX |
| Conservative or near a goal | Under 3 years | Ultra-short funds like VUSFX |
A few practical checks, drawn from mutual funds performance in last 5 years, before choosing among the best high-risk mutual funds for long-term growth:
- Overlap. Owning FSELX, FSPTX and VITAX together means owning NVIDIA three times.
- Cost. VITAX charges 0.09% versus 0.61% for FSPTX. Over five years, that 0.52 percentage point gap compounds meaningfully.
- Taxes. Actively managed sector funds can distribute capital gains. Holding them in an IRA or 401(k) avoids that drag.
- Fund vs ETF. Many of these strategies have ETF versions with lower costs and better tax efficiency, which explains the flow data above.
The SEC’s Investor.gov guide to mutual funds is a solid primer on fees, share classes and how to read a prospectus. PublishIQHub’s guides to top mutual fund companies for investing and various investment options cover the broader landscape, and the roundup of the best trading platforms for US stocks can help with choosing where to buy.
Conclusion
The record of mutual funds performance in last 5 years rewards investors who owned the right sectors and avoided long-duration bonds. Semiconductors, energy and gold delivered returns that left the Dow and NASDAQ far behind, while floating rate and high-yield funds were the bond market’s quiet winners.
The next five years start from a different place: a Fed that is hiking, a 10-year yield above 5%, and record concentration in a few AI names. That argues for checking overlap, keeping costs low and matching each fund to a real time horizon. For more data-driven finance coverage, explore the best fintech companies in the USA and the rest of the PublishIQHub finance library.
Frequently Asked Questions
What were the best performing mutual funds in the last 5 years?
On mutual funds performance in last 5 years, among widely available US no-load funds, Fidelity Select Semiconductors (FSELX) led with a 37.82% annualized return for the five years ended September 30, 2026. Fidelity Select Energy (FSENX) and Fidelity Select Gold (FSAGX) followed at 23.92% and 22.92%.
Which bond fund performed best over the last 5 years?
Fidelity Capital & Income (FAGIX) returned 6.38% a year over the period, followed by two floating rate funds, FFRHX and PRFRX, at 5.99% each. A broad core bond index fund, VBTLX, returned -0.65% a year.
Did mutual funds beat the Dow Jones and NASDAQ over 5 years?
The top sector and tech funds did. The Dow gained about 8.51% a year and the NASDAQ about 13.20% a year in price terms, while all five high-risk funds on this list returned more than 20% annualized. Most broadly diversified mutual funds did not beat the NASDAQ.
Are bond funds a good investment when the Fed is raising rates?
Short-duration and floating rate bond funds tend to hold up best when rates rise, because their income adjusts quickly. Long-duration bond funds lose value as yields climb, but they lock in higher income for the future.
What is the US equivalent of FII and DII holdings?
The US tracks institutional ownership through quarterly SEC 13F filings and foreign investment through the Treasury’s TIC data. US funds held about 33% of US corporate equity at the end of 2025, according to ICI.
Should I choose mutual funds or ETFs in 2026?
ETFs typically offer lower costs and better tax efficiency, which is why they took in record flows in 2025. Mutual funds still suit automatic investing and 401(k) plans.
Is it risky to invest in sector funds like semiconductors or gold?
Yes. Sector funds are concentrated by design. FSELX lost 29.26% in a single quarter in 2022, and gold funds went nearly a decade with modest returns before their recent rally. They work best as a small slice of a diversified portfolio.