
Disclaimer: This article is a study of MTAR Technologies’ historical price movement, financial data, and publicly disclosed information. It is not an investment suggestion or recommendation to buy, sell, or hold the stock. Readers should consult a SEBI-registered investment advisor and verify live prices before making any investment decision.
A PublishIQHub market study
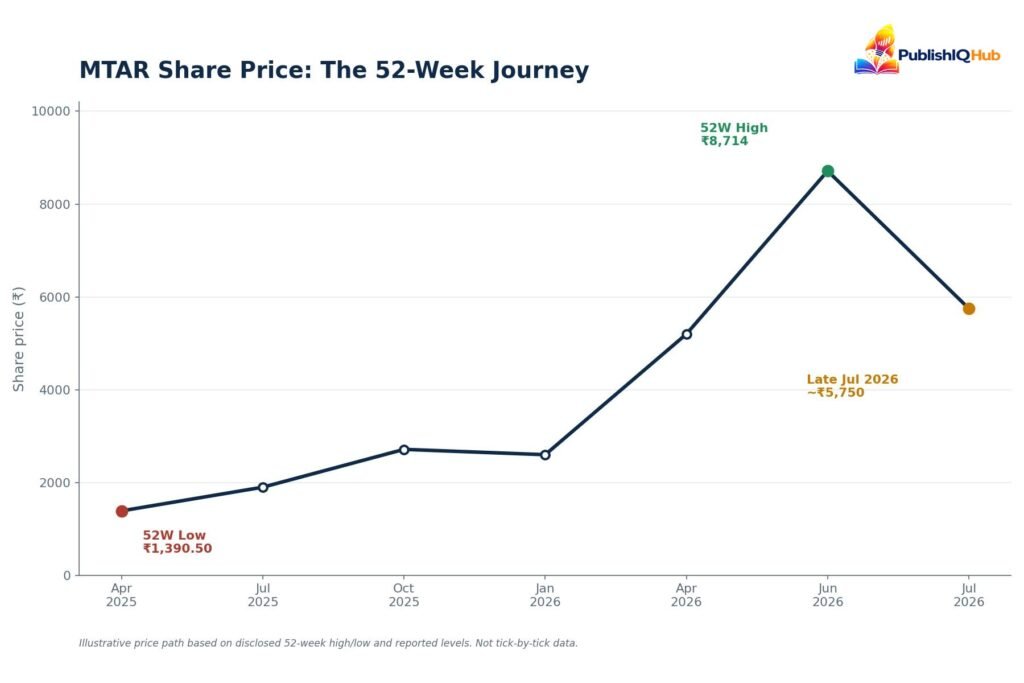
Somewhere between April 2025 and July 2026, a Hyderabad precision-engineering company that most retail investors had barely heard of turned into one of the most talked-about names on Dalal Street. The MTAR share price fell to a 52-week low of ₹1,390.50 in April 2025 and, within fifteen months, touched a 52-week high of ₹8,714 — a move of over 500%. By late July 2026, the stock had cooled off to trade in the ₹5,700–5,800 band, still up nearly 270% on a one-year basis.
That kind of swing is exactly why so many investors are searching for MTAR share price data right now — not just today’s quote, but the fuller picture. Where has the stock been, what does the company actually do, why did it correct so sharply after the rally, and what should someone researching this stock before an investment decision actually know? This piece pulls together the company profile, the high lows of shares over the last year, the latest quarterly numbers, and the disclosed growth drivers and risks that shape future trends — without telling you what to do with your money.
A quick note before we go further: MTAR share price moves fast, sometimes 5% or more in a single session on thin volumes. Every number in this article was accurate as of early August 2026, but by the time you’re reading this, the price will have moved. Always check the live quote on your broker’s app or the NSE/BSE website before acting on anything here.
MTAR Technologies Company Profile: From a Hyderabad Machine Shop to a Precision Engineering Powerhouse
Any company profile of MTAR has to start with how unglamorous its origins were. Three engineers — P. Ravinder Reddy, K. Satyanarayana Reddy and P. Jayaprakash Reddy — set up the business in 1969 to serve India’s post-embargo engineering needs, back when the country couldn’t simply import precision components for sensitive sectors. It was incorporated as a private limited company only in November 1999, and converted to a public limited company in November 2020, months before its stock market debut.
What MTAR actually makes is mission-critical hardware with tolerances of 5 to 10 microns — thinner than a human hair — for industries where a single defective part can ground a satellite launch or shut down a nuclear reactor. We’ve always found this the most underrated part of the MTAR story: this isn’t a company riding a hype cycle, it’s one that spent five decades building metallurgy and precision-machining capability that’s genuinely hard to replicate.
Business Segments and Key Clients
MTAR operates across four core segments: Civil Nuclear Power, Space, Defence & Aerospace, and Clean Energy. On the nuclear side, it’s one of the top three suppliers of precision components — think fuelling machine heads, coolant channel assemblies and drive mechanisms — to the Nuclear Power Corporation of India (NPCIL).
In space, it has supplied liquid propulsion engine components for ISRO missions going back to the original Vikas Engine and continuing through GSLV Mark III hardware. On defence, it’s built base shroud assemblies for the Agni missile programme and actuators for HAL’s Light Combat Aircraft, and counts Israel’s Rafael and Elbit among its clients.
The clean energy segment deserves special mention because it’s currently the growth engine. MTAR has supplied hydrogen boxes and electrolysers to US-based Bloom Energy for close to a decade and remains its sole India-based supplier. This relationship is a double-edged sword we’ll come back to — it drives spectacular growth in good quarters and equally spectacular volatility when Bloom’s own stock wobbles.
IPO History and Listing Details
MTAR Technologies went public in March 2021 — the IPO opened on March 3 and closed on March 5, with a price band of ₹574–575 per share, raising close to ₹596 crore through the issue of roughly 1.04 crore equity shares. JM Financial and IIFL Securities ran the book. The issue was massively oversubscribed, with reports of the overall subscription crossing 200 times, and the stock listed on both the NSE and BSE on March 16, 2021.
Early investors who held on through the ups and downs have seen the MTAR share price move from a ₹575 issue price to well over ₹5,000 within roughly five years — though, as with any single-stock story, that headline return glosses over some brutal drawdowns along the way, including a stretch below ₹900 in March 2021 and another dip to ₹1,152–1,390 as recently as April 2025.
MTAR Share Price Today: Where It Stands
As of the last week of July 2026, here’s the snapshot investors were working with:
| Metric | Value (as of late July 2026) |
| MTAR share price | ₹5,700–5,800 range |
| 52-week high | ₹8,714 |
| 52-week low | ₹1,390.50 |
| Market capitalisation | ~₹17,600 crore |
| P/E ratio | ~124x (trailing) |
| P/B ratio | ~20–26x |
| Promoter holding | 29.4% |
| FII holding | ~24.8% |
| DII holding | ~22.4% |
| Public / retail holding | ~23.5% |
| 1-year return | ~270% |
| 1-month return (as of late July) | Roughly -28% |
A triple-digit P/E and a price-to-book ratio north of 20 tells you the market has priced in a lot of future growth already. That’s not unusual for a company in the defence-and-space precision engineering space — peers trade richly too — but it does mean the MTAR share price has very little room for disappointment. Any earnings miss or order delay tends to get punished hard, and we’ll see exactly that play out in the next section.
MTAR Technologies 52 Week High and Low: A Volatile Ride
Looking at the high lows of shares over the trailing twelve months tells the real story better than any single price point. The stock bottomed at ₹1,390.50 in April 2025 — a level it had actually dipped below earlier too, touching ₹1,152 in some data series — as the broader smallcap and defence-ancillary space went through a rough patch.
From there, a combination of strong FY26 order inflows, a rerating of India’s defence and clean-energy manufacturing theme, and repeated large purchase orders from Bloom Energy sent the stock on an extraordinary run, eventually hitting its 52-week high of ₹8,714.
That high didn’t hold. By late July 2026, the MTAR share price had pulled back roughly 30-35% from the peak, briefly dropping into the ₹5,400–5,800 zone and, on at least one trading session, falling nearly 5% in a single day around its Q1 FY27 results announcement.
For context on how sharp that correction was: the stock reportedly hit lower circuits on six of seven trading sessions in one stretch, and fell below both its 50-day and 100-day moving averages for the first time in 2026 — a meaningful shift in technical momentum after months of relentless upward movement.
If you’re studying the high lows of shares pattern here, the takeaway isn’t “buy the dip” or “sell the rally” — it’s that this stock has historically moved in wide, fast bands in both directions, and anyone tracking it needs to be comfortable with that kind of volatility before going anywhere near it.
Why Is MTAR Share Price Falling? Understanding the Recent Correction
Two forces converged on the MTAR share price through mid-2026. The first was company-specific: weakness in Bloom Energy’s own US-listed stock, which fell sharply over a matter of weeks, spooked investors who worry about MTAR’s revenue concentration in that single client relationship. When your largest customer’s shares are under pressure, the market tends to mark you down too, fairly or not.
The second was macro. Foreign institutional investors pulled capital out of Indian equities broadly through parts of FY26, partly in reaction to US tariff announcements affecting Indian exports, and richly valued smallcap names like MTAR — where a large chunk of the float is held by FIIs and retail investors rather than long-term domestic institutions — tend to see outsized selling in these risk-off phases.
Add in some profit booking after a 500%+ run in fifteen months, and a 30% pullback starts to look less like a red flag and more like ordinary mean reversion after an extraordinary rally.
MTAR Technologies Quarterly Results and Earnings: The Q1 FY27 Numbers
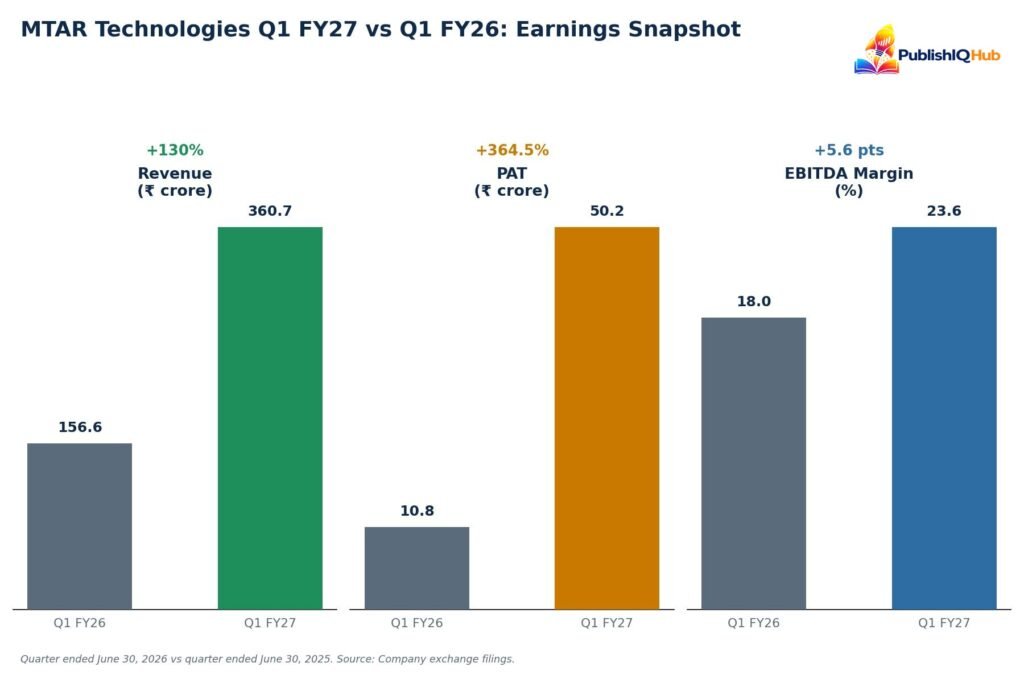
The most recent quarterly print — for the quarter ended June 30, 2026 (Q1 FY27), as disclosed on MTAR Technologies’ official investor relations page — actually came in strong, even as the stock fell into the results. Revenue from operations rose 130% year-on-year to ₹360.7 crore, up from ₹156.6 crore in the same quarter last year, and 18% higher than the preceding quarter. Profit after tax jumped 364.5% YoY to ₹50.2 crore, from ₹10.8 crore a year earlier. EBITDA came in at ₹85.1 crore, with margins expanding to 23.6% from around 18% a year ago.
Order book visibility looked healthy too, with management citing a diversified order book above ₹5,100 crore as of the June quarter, including a large ₹504 crore order for the Kaiga 5 & 6 nuclear power project and fresh orders from data-centre infrastructure client SLB.
Management reiterated FY27 guidance of roughly 80% revenue growth — raised from an earlier 50% target — alongside a 24% EBITDA margin goal. On paper, the fundamentals of the quarter didn’t match the price action; the stock still fell close to 5% around the results, which tells you the correction was driven more by sentiment and valuation reset than by any disappointment in the actual numbers.
MTAR Technologies Fundamental Analysis: Ownership and Balance Sheet
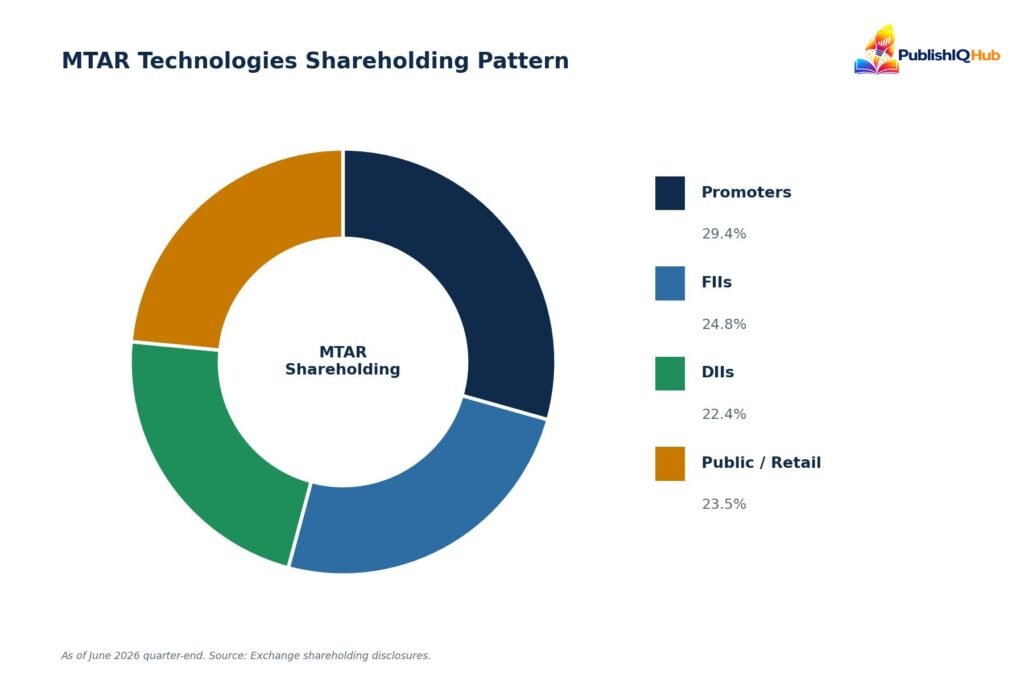
A proper fundamental analysis of MTAR starts with who owns the stock. Promoter holding stood at 29.4% as of the June 2026 quarter — a level that’s drifted down slightly over recent years as some promoter entities have trimmed stakes, which is worth watching but isn’t unusual for a company that’s diversified its shareholder base since listing.
FIIs held roughly 24.8%, DIIs around 22.4%, and the remaining ~23.5% sat with retail and other public shareholders — a fairly high retail participation rate for a stock of this size, which partly explains why price swings tend to be sharper in both directions.
On profitability, MTAR’s return on equity has actually been on the lower side historically — around 9-10% over a three-year average — even as revenue and profit growth have accelerated sharply in FY26 and Q1 FY27.
Debtor days have also crept up, from roughly 115 to 140 days, which is typical for a company supplying government and defence-linked entities where payment cycles run long, but it’s a working-capital dynamic worth tracking. The company does not currently pay a dividend, reinvesting instead into capacity expansion across its Hyderabad manufacturing base.
MTAR Technologies vs Peers Comparison
Placed alongside its closest listed peers in India’s precision-engineering-for-defence-and-space space — Azad Engineering, Paras Defence and Space Technologies, and Mishra Dhatu Nigam (MIDHANI) — MTAR tends to sit in the middle of the pack on market capitalisation but stands out for revenue growth.
Azad Engineering, which makes forged and machined aerospace components like turbine blades and blisks, has generally carried stronger margins and profitability quality; MTAR has recently outpaced it on top-line growth and cash generation, largely thanks to the Bloom Energy-driven clean energy segment. Paras Defence, with its optics and space-systems focus, and MIDHANI, a specialty metals supplier, round out the peer set that analysts typically use for comparison.
None of these stocks are cheap. That’s the nature of India’s precision-engineering and defence-ancillary theme right now — investors are paying up for scarcity value, since there simply aren’t many listed companies with the certifications and track record to supply ISRO, DRDO and NPCIL directly.
Future Trends: Growth Drivers and Risk Factors
We’d rather lay out what’s disclosed and let you draw your own conclusions than hand you a price target — MTAR’s own price history over the past year shows exactly why single-number targets age badly within weeks.
What we can say is that the growth drivers management has pointed to are concrete: an order book above ₹5,100 crore, raised FY27 revenue guidance of 80%, ongoing capacity expansion at its Hyderabad facilities, diversification into new areas like oil & gas and data-centre infrastructure, and continued indigenisation tailwinds in India’s defence and nuclear sectors.
The risk factors are equally concrete and worth weighing just as seriously. Client concentration is the big one — a meaningful share of revenue still flows through Bloom Energy, and any slowdown in Bloom’s own fuel-cell demand would hit MTAR directly. Government budget cycles for ISRO, DRDO and NPCIL can shift project timelines. And at a P/E north of 100x, the stock is pricing in years of continued high growth, which leaves limited room for execution slip-ups.
Some brokerages have published bullish coverage notes with specific price targets over the past year, but those targets have moved dramatically as the stock itself moved — which is exactly why we’d point you to your broker’s research section or a SEBI-registered advisor for the latest live target, rather than repeat a number here that may already be stale.
Is MTAR Technologies Share Good to Buy? What to Consider Before Deciding
This is probably the single most searched question about this stock, and it’s also the one we’re least qualified — and least willing — to answer for you directly. What we can offer is a framework: match the stock’s characteristics against your own situation.
MTAR is a high-growth, high-volatility, high-valuation smallcap with genuine competitive moats in a niche, government-and-defence-linked industry, and a single-customer concentration risk that’s real. That profile tends to suit investors with a longer time horizon and higher risk tolerance more than someone looking for capital stability.
Should you invest in MTAR Technologies stock? That depends on your portfolio allocation to smallcaps, your existing exposure to the defence and aerospace theme, and your ability to stomach 30%+ drawdowns without panic-selling — because this stock has already demonstrated it’s capable of exactly that kind of move, in both directions, within a matter of weeks.
If you’re still choosing where to hold and trade the stock, our comparison of stock brokers in India breaks down platforms by brokerage fees and research tools. A SEBI-registered investment advisor who can see your full portfolio is far better placed to answer this than any blog post.
Frequently Asked Questions
1. Is MTAR Technologies share good to buy?
That depends on individual risk appetite and portfolio goals. MTAR is a high-growth, high-valuation smallcap with strong order-book visibility but real client-concentration risk. This article studies its price and fundamentals; it isn’t a recommendation to buy, sell or hold.
2. What is MTAR Technologies’ 52-week high and low?
As of late July 2026, the 52-week high was ₹8,714 and the 52-week low was ₹1,390.50 — a range of roughly 6x, reflecting the stock’s exceptional volatility over the past year.
3. Why is MTAR share price falling?
The pullback from its 52-week high has been driven by weakness in largest-client Bloom Energy’s own stock, broader FII selling amid global risk-off sentiment, and profit booking after the stock’s 500%+ rally between April 2025 and mid-2026.
4. What were MTAR Technologies’ latest quarterly results?
For Q1 FY27 (quarter ended June 30, 2026), revenue rose 130% YoY to ₹360.7 crore and profit after tax jumped 364.5% YoY to ₹50.2 crore, with EBITDA margins expanding to 23.6%.
5. How does MTAR Technologies compare to its peers?
Against peers like Azad Engineering, Paras Defence and Space Technologies, and MIDHANI, MTAR generally shows stronger revenue growth and cash generation, while some peers carry better margins. All trade at rich valuations reflecting the scarcity of listed precision-engineering defence suppliers in India.